Email:
zhaizhongbing723@gmail.com
深圳市由你创科技有限公司 -- 软件行业的源头工厂


zhaizhongbing723@gmail.com


什麼是數據可視化?
數據可視化是指透過圖表、圖形等可視化方式呈現複雜數據,幫助使用者更好地理解數據,發現數據中的模式、趨勢和關聯。數據可視化是為了更生動地表達數據的內在信息和規律,促進數據信息的傳播與應用。它能幫助人們更好地理解和利用數據,以做出更佳決策。
什麼是大屏幕數據可視化?
大屏幕數據可視化是在大屏幕上以可視化方式呈現數據的方法。大屏幕數據可視化能夠以圖形化方式在屏幕上顯示大量數據,幫助使用者更好地分析和理解數據。大屏幕數據可視化常用於呈現實時數據或儀表板,協助管理層更好地掌握和管理生產流程、業務運營等各個方面。
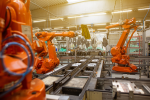
數據可視化大屏幕在工業製造中的應用場景主要包括:
數據可視化大屏幕的主要功能包括:
數據顯示:將處理後的數據透過可視化方式在大屏幕上顯示,方便管理層實時監控生產狀態
數據分析:分析呈現的數據,發現問題和提升生產效率的機會
數據採集:透過傳感器、監控設備等收集實時數據
數據處理:對採集的數據進行處理和分析,提取關鍵指標
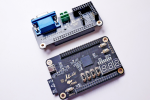
工控擷取板卡定制開發
一、 明確需求 信號類型與數量: 性能指標: 環境要求: 機械與電氣介面: 軟體與驅動: 可靠性與維護: 成本 […]
影像擷取上位機系統開發
一、核心概念 上位機: 指運行在主機(通常是PC或工控機)上,用於監控、控制下位機(如相機、影像擷取 […]
工業視覺缺陷檢測算法開發
一、 明確需求與定義問題 二、 數據採集與預處理 三、 算法選擇與開發 這是核心環節,通常分為傳統圖像處理和深 […]
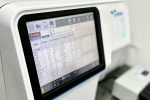
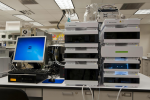
細胞分析儀上位機系統開發
一、 系統核心架構設計 二、 核心功能模組 三、 技術選型建議 組件 推薦技術 說明 開發語言 C#  […]
機器人運動控制卡定製開發
一、 核心定制要素(需明確需求) 機械人類型與應用場景: 工業機械臂(關節數:4軸、6軸、7軸?協作機械人?) […]
數據處理上位機軟件開發
一、 明確核心需求 數據源: 連接什麼設備? (PLC型號? 串口設備? 以太網設備? 特定儀器? 數據庫? […]
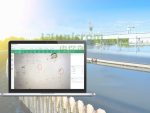
水底藻類檢測標識系統桌面應用開發
項目背景 本系統主要針對不同水域進行浮游生物檢測,旨在實現浮游生物鑑定與計數的自動化。系統內建豐富的浮游生物數 […]
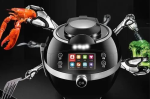
智能家居生活廚房系統:雙端烹飪機械人應用程式開發
項目背景 為提升公司產品於市場上的核心競爭力並開拓海外市場,客戶需要對其產品軟件服務進行升級,以實現物聯網軟件 […]

智能除草機 Android 與 iOS 流動雙平台控制應用程式開發與定制
案例背景 隨著科技進步與社會廣泛應用,社會發展的形態與結構正逐步朝向更深層次的融合與質變邁進。在當今國際化理念 […]
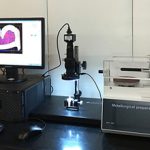
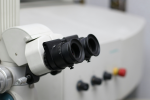
實驗室顯微鏡自動化控制主機系統開發
項目背景 某生物科技公司專注於特定細胞分析,實驗過程中需大量使用顯微鏡操作。Unicrom 根據客戶需求,定制 […]
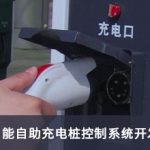
新能源電動車智能自助充電站控制系統開發
項目背景 隨著智能電網、智能車輛及新能源汽車的發展,新能源汽車充電樁已成為電動車普及的關鍵技術。智能自助充電樁 […]

跨境電商店鋪代理申報平台系統:歐代獨立申報軟件定制開發
案例背景 根據歐盟商品安全與市場新規,2021年7月16日起,所有帶有CE標誌的跨境電商平台商品,必須設有位於 […]